I explain the method. I guess it's the very opposite of I Ching. Here's a file with the machine generated algorithm that contains all profitable patterns in EUR/USD data from 2005 on:
Workshop7_EURUSD.c
It's a normal C function, so you can theoretically paste it in a Empty4 EA and trade it, after some small modifications. The function begins like this:
Code: Select all
int EURUSD_L(float* sig)
{
  if(sig[1]<sig[4] && sig[4]<sig[5] && sig[5]<sig[2] && sig[2]<sig[3] && sig[3]<sig[0] && sig[10]<sig[11] && sig[11]<sig[7] && sig[7]<sig[8] && sig[8]<sig[9] && sig[9]<sig[6])
    return 42;
  if(sig[4]<sig[5] && sig[5]<sig[1] && sig[1]<sig[2] && sig[2]<sig[3] && sig[3]<sig[0] && sig[10]<sig[7] && sig[7]<sig[8] && sig[8]<sig[6] && sig[6]<sig[11] && sig[11]<sig[9])
    return 84;
  if(sig[4]<sig[1] && sig[1]<sig[2] && sig[2]<sig[0] && sig[0]<sig[5] && sig[5]<sig[3] && sig[7]<sig[10] && sig[10]<sig[11] && sig[11]<sig[8] && sig[8]<sig[6] && sig[6]<sig[9])
    return 29;
  if(sig[1]<sig[4] && sig[4]<sig[2] && sig[2]<sig[5] && sig[5]<sig[0] && sig[0]<sig[3] && sig[7]<sig[10] && sig[10]<sig[8] && sig[8]<sig[11] && sig[11]<sig[9] && sig[9]<sig[6])
    return 82;
  ....
  return 0;
}
The function has the name EURUSD_L, meaning it's for long trades with EUR/USD. The list of candle prices is passed to the function as a pointer to a float array named sig. If I'm not mistaken, Empty4 does not support floats and pointers, so you have to change that to something like (double& sig[]). Anyway it evaluates 12 prices, sig[0] to sig[11], which are the Low, High, and Close of the last 3 candles:
sig[0]...sig[11] = H2, L2, C2, H1, L1, C1, H1, L1, C1, H0, L0, C0.
For technical reasons the middle candle appears twice, therefore we have 12 variables and not 9.
The function contains many if() conditions with many comparisons of prices with other prices. Any if() condition represents a pattern. The comparisons are linked with &&, so the if() condition is true when all its comparisons are true. In this case a certain value, like 42 in the first if() condition in the example, is returned by the function. If none of the if() conditions is true, 0 is returned, meaning that no pattern is found. The returned value is the pattern's score - its information ratio multiplied with 100. The higher the information ratio, the more predictive is the pattern.
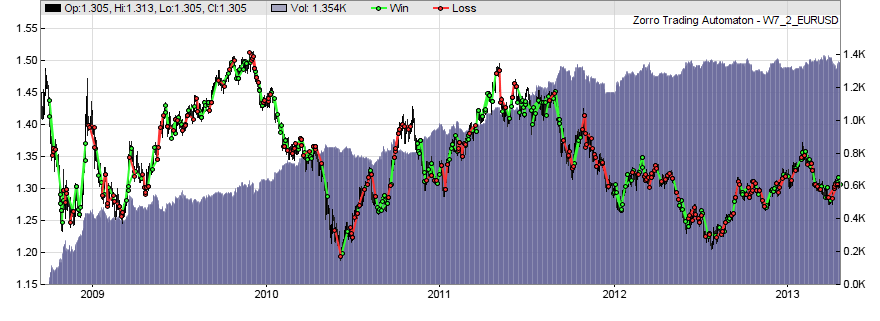
When the function is called with the prices of the last 3 candles, it enters a trade when the score is above a limit. The equity curve above with the 223% annual profit uses a limit of 30. So any pattern with a score above 30 triggers a trade.
The function is generated by going through the training data and simulating a long and short trade at every bar. The results of the trades are stored together with the preceding candle pattern. So we get a large pattern list. The computer then throws away all patterns that occur less than 4 times or don't precede profitable trades. This reduces the pattern list to about 100 patterns. For every pattern the information ratio is calculated, that's the quotient of profit mean over standard deviation. This is then the return value of that pattern in the generated function.
I hope that explains how the method works. Unfortunately it does not explain why the method works.
You do not have the required permissions to view the files attached to this post.

 but I suppose I could modify my code to detect it...